Your DAW already has a spectrum analyzer built into its stock EQ, and for plenty of mixing decisions, that’s enough. But there’s a point where the built-in option runs out of resolution, flexibility, or simply doesn’t show you what you need to see in the way you need to see it.
That’s where dedicated spectrum analysis plugins earn their place in a session, by giving you visual information that’s detailed enough to act on rather than just glance at. The difference between a basic frequency readout and a properly configured analyzer with adjustable FFT sizes, customizable ballistics, and reference comparison tools is the difference between guessing and knowing.
What I want to address upfront is that a spectrum analyzer will not fix your mix. It shows you what’s happening, and the value of that information depends entirely on whether you know how to interpret it and what to do about it.
I’ve seen producers stare at an analyzer display, make the graph look perfectly smooth, and end up with a lifeless mix because they were chasing visual perfection instead of listening.
These tools work best as a second opinion alongside your ears, not as a replacement for them. The plugins on this list range from focused frequency displays to comprehensive metering suites that cover loudness, phase, and stereo imaging alongside spectral analysis, and the right choice depends on whether you need a simple visual reference or a full diagnostic toolkit.
1. VISION 4X by Excite Audio
Excite Audio developed VISION 4X in collaboration with Noisia, the Dutch electronic music trio known for some of the most technically precise productions in drum and bass and bass music. That partnership wasn’t just a branding exercise. Noisia started the project because they wanted to consolidate the features from multiple analysis tools they were already using into a single plugin that could display everything simultaneously without switching windows.
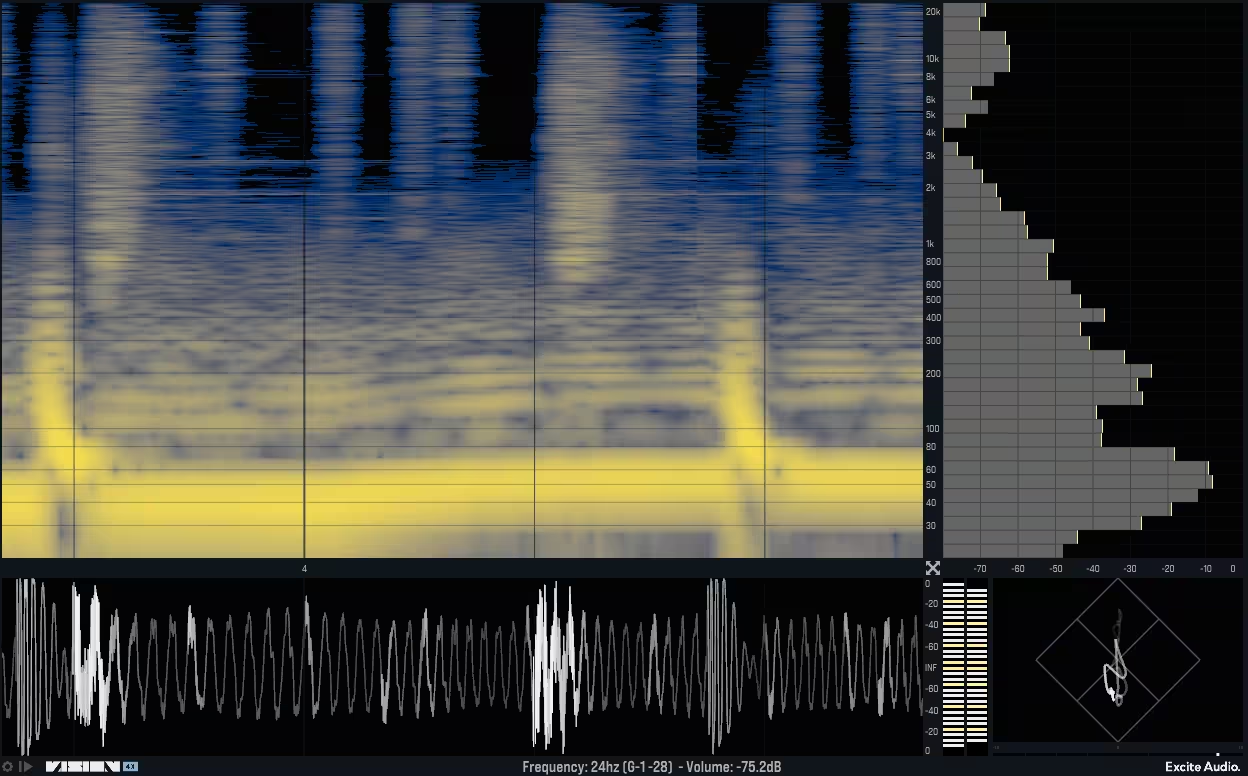
The result is a four-panel visual analysis environment that runs a spectrogram, bar graph, waveform display, and phase correlation meter all at once in a resizable, modular layout.
The plugin is clearly built with electronic music production in mind, though it’s useful well beyond that genre. At around $89 for the full version, it sits at the higher end of analyzer pricing, and some users have noted that running all four panels simultaneously can be demanding on CPU.
A Lite version is also available for producers who only need the spectrogram and don’t require the full four-panel layout.
- Spectrogram and References
The spectrogram at VISION 4X’s core provides higher resolution in the low frequency range than most competing analyzers, which matters because the sub-bass and bass regions are exactly where frequency buildup problems tend to hide.
Three visualization modes let you optimize the display for different tasks: Transient mode reveals the attack and release characteristics of individual hits, Harmonic mode emphasizes sustained tonal content and overtone relationships, and All-round gives a balanced overview suited to general mixing.
Ten selectable color maps change how intensity is represented visually, and each one has been chosen for maximum information density rather than aesthetic appeal. The Map Bias control shifts color emphasis toward either low or high frequencies, which is a small but meaningful adjustment when you’re trying to identify specific problems in a crowded low end.
Freeze and zoom functionality lets you capture a moment in the audio and drill down into the spectral detail at a level that continuous real-time analysis can’t provide.
Where VISION 4X becomes particularly valuable for mixdown work is its genre-based reference curve system. Excite Audio analyzed hundreds of commercially released tracks across genres including pop, house, drum and bass, dubstep, and trap, then generated average and maximum frequency distribution curves for each. Loading a reference overlays it on your bar graph analyzer, and any frequency bands that exceed the reference maximum are highlighted in red.
You can also capture your own reference curves by running tracks through the analyzer, which lets you compare your mix against specific releases rather than broad genre averages.
- Four-Panel Layout
Beyond the spectrogram and bar graph, VISION 4X includes a waveform analyzer for inspecting audio at the sample level, accompanied by VU and RMS metering with overshoot highlighting that flags when levels cross 0dB.
The phase correlation meter displays the relationship between left and right channels along a center line, making it straightforward to spot mono compatibility issues that might cause audio to disappear or thin out on single-speaker playback systems.
All four analysis panels live in independently resizable panes within a single plugin window, and you can drag the dividers to create configurations ranging from a full four-panel grid to a single maximized view.
The display can run in continuous mode or an overlay mode that loops a defined timeframe and redraws the analysis on top of itself, building up a cumulative picture of your audio’s frequency behavior over a specific section. MIDI retriggering restarts the analysis on every received note, which is useful for comparing individual drum hits or synth notes in isolation. The plugin runs as VST, VST3, AU, AAX, and standalone on both macOS and Windows.
2. VoxengoSPAN (Free)
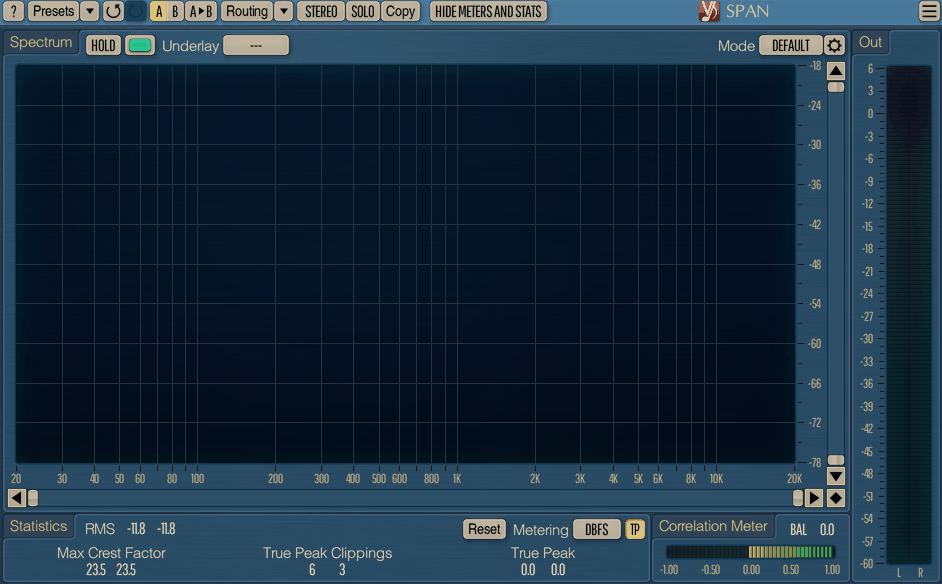
SPAN has been around for a long time, and it’s become the default recommendation whenever someone asks for a free spectrum analyzer. The reason is straightforward: it covers the essential frequency analysis functionality without any trial limitations, watermarks, or feature gates designed to push you toward a paid upgrade.
Voxengo offers a paid SPAN Plus with additional features like multi-track overlay and K-system metering, but the free version is a complete, functional tool on its own.
That said, SPAN is a spectrum analyzer and nothing more. There’s no spectrogram, no phase meter, no loudness metering, no reference comparison system. If you need any of those things, you’ll need to supplement it with other tools.
The interface also looks dated compared to modern alternatives, and the settings panel can feel dense for new users who aren’t familiar with terms like FFT size, window type, and block overlap. For a straightforward frequency display that shows you what’s happening across the spectrum, it does the job without complications.
- Configurable FFT Analysis
SPAN’s analysis engine lets you adjust the FFT block size from small windows that favor time resolution to larger blocks that provide finer frequency discrimination, and you can set the overlap percentage to control how frequently the analysis updates.
The frequency range displayed is fully adjustable, and the analyzer can show the full audible spectrum or zoom into a narrower band for focused analysis of a specific region.
The display supports multiple spectrum channels simultaneously, including left, right, mid, and side analysis on the same graph, each with its own configurable color. You can switch between peak and RMS display, adjust the release speed of the visual response, and toggle between a smoothed curve and a more detailed view.
An adjustable slope tilts the display to compensate for the natural roll-off of musical content toward higher frequencies, which makes it easier to visually assess the overall balance without the graph always appearing bottom-heavy. SPAN runs in VST, VST3, AU, and AAX formats on macOS and Windows, and the installation process requires only downloading the installer from Voxengo’s website.
- Sidechain Comparison
One feature that makes SPAN more useful than most free analyzers is its ability to accept a secondary audio input through sidechain routing, which is displayed as a separate overlay on the same graph. This lets you compare the frequency profile of your track against a reference mix in real time by routing the reference audio into SPAN’s sidechain.
The two spectra are drawn in different colors, and the visual comparison makes it immediately obvious where your mix deviates from the reference in terms of overall frequency balance.
Setting this up requires your DAW to support sidechain routing to analysis plugins, which most modern DAWs handle without issue. The comparison isn’t as elegant as the built-in reference systems found in paid analyzers like VISION 4X or sonible true:balance, but the functionality is there and it costs nothing to use.
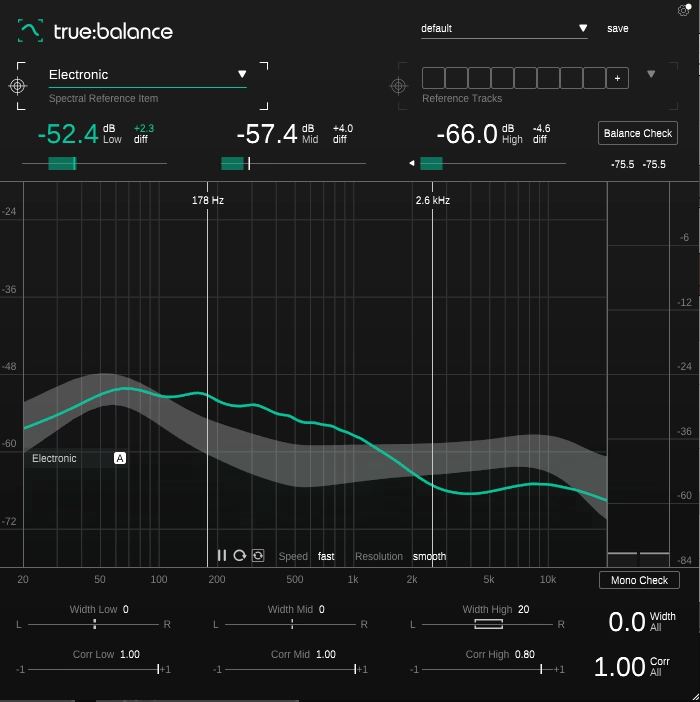
3. sonible true:balance
sonible approached spectrum analysis from a perspective that most analyzer developers overlook: the average producer doesn’t need to see every detail of the frequency spectrum at maximum resolution. What they need is a clear, honest answer to the question of whether their mix’s frequency balance is in the right neighborhood for the genre they’re working in.
true:balance is built entirely around that practical question, and every element of the interface serves the goal of helping you evaluate your spectral distribution relative to a target rather than simply showing you a frequency curve and leaving the interpretation to you.
The interface is dominated by a central frequency display that overlays your audio’s real-time spectrum and its time-averaged frequency curve against a reference envelope, creating an immediate visual comparison.
The Austrian company behind it has a track record of building plugins that prioritize clarity of information over density of features, and true:balance follows that philosophy closely.
It’s available individually or bundled with the true:level loudness meter, and the pricing is modest relative to the competition.
- Genre References
true:balance ships with genre-specific reference presets built from analysis of a large body of commercially released music. Each reference generates a shaded frequency envelope that represents the expected spectral distribution for that genre, and your audio’s average spectrum is displayed against it so you can see exactly where your mix sits relative to the target.
The display breaks the spectrum into low, mid, and high bands with adjustable crossover points at 150Hz and 4kHz by default, and numeric readouts show how your levels in each band compare to the reference.
For producers who want to match specific mixes rather than broad genre averages, true:balance accepts up to eight custom reference tracks that you can load and switch between during a session. This is especially useful when working on albums or EPs where you need consistency across multiple songs, because you can load your finished tracks as references while mixing new ones and immediately see how their spectral profiles compare. The references draw from the audio you feed them rather than from precomputed data, so the comparison reflects actual signal analysis rather than statistical approximations.
- Balance and Mono Check
Beyond the visual display, true:balance includes a Balance Check function that analyzes your current frequency distribution against your chosen reference and provides text-based suggestions about what adjustments might improve the balance.
The guidance is practical and restrained rather than prescriptive, offering observations like whether your low end is sitting above or below the reference rather than telling you to cut 3dB at 120Hz. It’s aimed at producers who are still developing their ear for frequency balance and need a sanity check more than they need detailed instructions.
The Mono Check feature examines your stereo signal for potential compatibility issues and flags areas where collapsing to mono could cause problems.
The channel data section provides stereo width and correlation values across the spectrum, so you can identify exactly which frequency ranges are contributing to any mono issues rather than just knowing there’s a problem somewhere. true:balance runs as AU, AAX, VST, and VST3 on macOS and Windows.
4. iZotope Insight 2
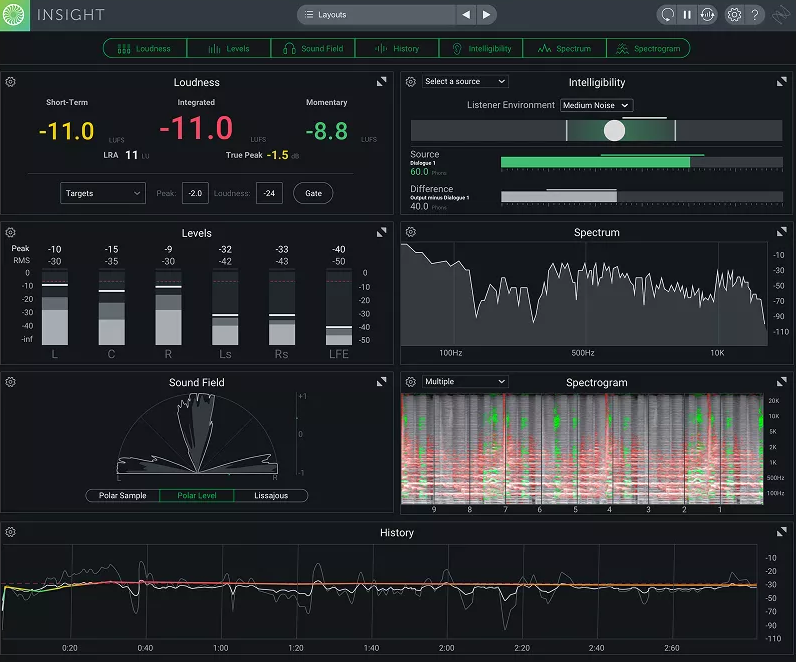
Insight 2 is less a spectrum analyzer and more a full-scale audio metering environment that happens to include a highly capable spectrum analyzer among its many displays.
iZotope built it as the visual nerve center for professional mixing and mastering workflows, where you need simultaneous access to loudness data, spectral analysis, stereo imaging, and intelligibility metrics without opening four separate plugins.
The plugin is designed to sit on your master bus or monitoring chain and give you a comprehensive diagnostic overview of everything that’s happening in your output signal.
The scope of what Insight 2 covers is significantly broader than anything else on this list, and the pricing reflects that ambition. It’s available as part of various iZotope bundles and subscriptions, or as a standalone purchase.
For engineers who work in broadcast, post-production, or any environment where loudness compliance and delivery specifications are non-negotiable, Insight 2 is one of the most established tools in the category.
- Modular Metering Panels
The spectrum analyzer in Insight 2 provides both a real-time frequency curve and a scrolling spectrogram display that shows how the frequency content evolves over time.
The spectrogram uses color intensity to represent amplitude at each frequency, giving you a visual history of your audio that can reveal patterns and problems that a static spectrum curve might miss, like intermittent resonances that only appear during certain sections or transient frequency spikes that vanish too quickly for a standard analyzer to catch.
The metering layout is fully modular, meaning you can open, close, resize, and rearrange the individual meter panels to create a custom monitoring configuration that matches your specific workflow.
If you only need the spectrum analyzer and the loudness meter, you can close everything else and expand those two panels to fill the window. If you’re preparing a delivery for broadcast and need loudness, true peak, dialogue intelligibility, and spectral analysis all visible simultaneously, you can build that layout and save it as a preset.
- Loudness Compliance
Insight 2 includes LUFS metering that complies with major broadcast standards including EBU R128, ATSC A/85, and other international specifications. The meter displays integrated, momentary, and short-term loudness alongside true peak values, and you can set target levels and tolerances so the display clearly indicates when your output is within spec.
For music production, the loudness metering helps ensure your masters will play back at the intended level on streaming platforms without unexpected normalization.
The intelligibility meter is a feature unique to Insight 2 in this list, measuring how clearly spoken dialogue cuts through a mix. This is primarily useful for film, podcast, and broadcast work, but it can also serve music producers who want to evaluate vocal clarity against a dense instrumental arrangement.
Insight 2 runs as VST, VST3, AU, and AAX on macOS and Windows, and can also operate in a relay mode that collects metering data from iZotope plugins on individual tracks and displays the aggregate information on a single Insight 2 instance on the master bus.
5. SIR Audio Tools Spectrum Analyzer
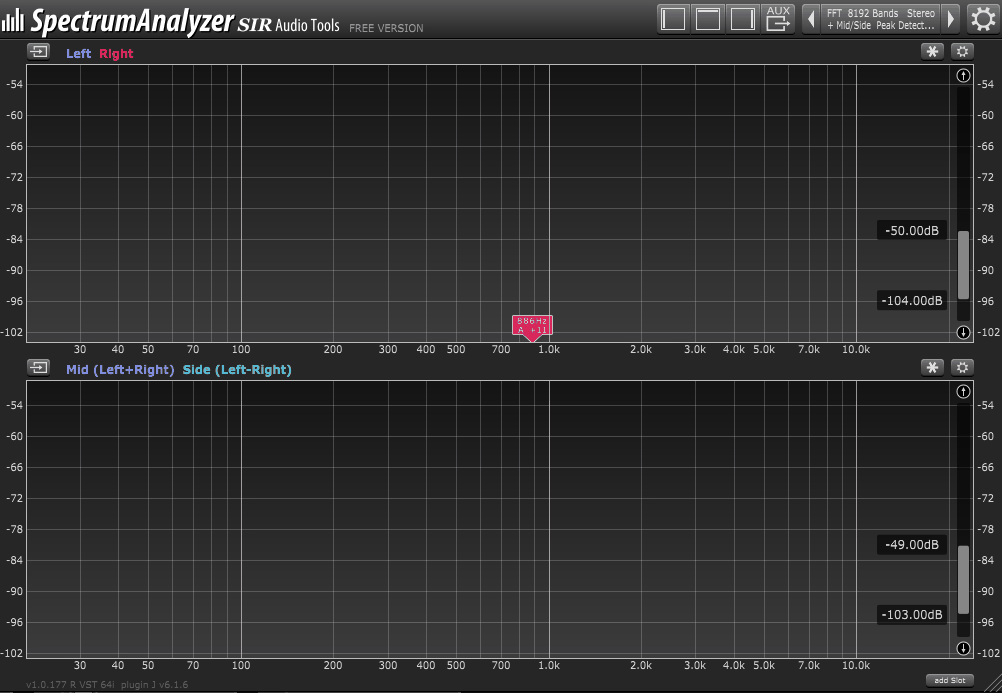
Christian Knufinke’s SIR Audio Tools has been quietly producing well-regarded audio tools for years, and the SpectrumAnalyzer is a technically impressive plugin that offers something most competitors don’t: a dual-engine analysis system that runs FFT and analog-style bandpass filter analysis simultaneously.
The FFT engine provides fine frequency resolution with the detail you’d expect from any decent analyzer, while the bandpass filter engine offers better time resolution that can track fast transients more accurately than FFT alone. Running both at once gives you a more complete picture than either engine could deliver individually.
- Auxiliary Routing
The standout workflow feature in SIR SpectrumAnalyzer is its auxiliary system that lets you send audio from one plugin instance into another. You place a SpectrumAnalyzer instance on every track or bus you want to monitor, activate the aux send on each one, and then on a single master instance, you can switch between those aux channels to view the spectrum of any track without leaving the plugin window.
This is a genuinely powerful setup for comparing the frequency profiles of multiple elements in a mix. Want to see how your bass synth and kick drum overlap in the low end? Put an instance on each track, send both to a master instance, and toggle between them.
The full version supports up to 4 simultaneous slots in a single instance, so you can overlay the spectra of multiple signals at once and visually assess where they compete. The system works within a single DAW session using internal memory sharing rather than bus routing, which makes setup faster than traditional sidechain-based comparison methods.
- Peak Detection
The analyzer includes an automatic peak detection system that identifies and labels the most prominent resonant frequencies in your signal, which saves you from manually sweeping a narrow EQ band to find problematic peaks.
The detected frequencies are displayed directly on the spectrum curve with their precise Hz values, making it easy to jump straight to a specific frequency in your EQ and address the issue.
The customization depth goes well beyond what most analyzers offer. You can adjust FFT size and window type, control the number of bandpass filter bands and their steepness, set the time resolution and release speed independently for each engine, and configure mid/side analysis in separate slots. The color of every displayed channel is user-configurable, and the plugin window is freely resizable with the dimensions saved per instance. A snapshot function lets you capture the current analyzer state for later comparison against other material. SpectrumAnalyzer runs as VST, VST3, AU, and AAX on macOS and Windows.
6. IK Multimedia Metering
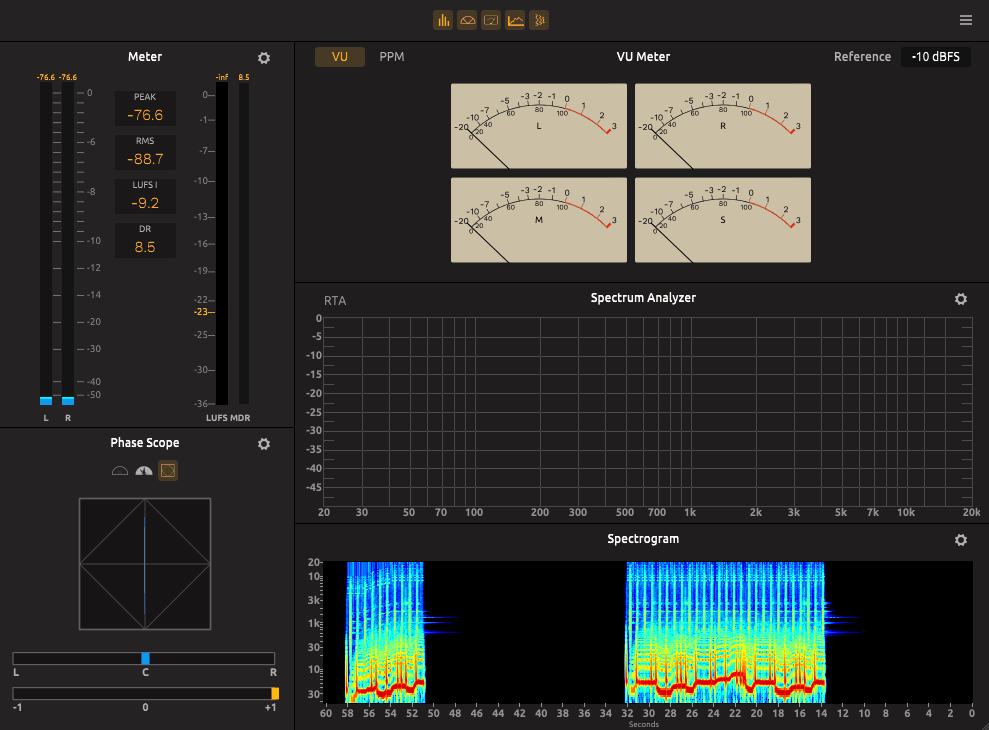
IK Multimedia’s Metering module exists as part of the T-RackS ecosystem, and it provides a comprehensive set of visual tools that cover far more ground than spectrum analysis alone. The module packs a real-time frequency analyzer, spectrogram, phase scope, stereo correlation meter, LUFS loudness meter, peak and RMS meters, dynamic range display, and VU/PPM meters into a single resizable interface.
It’s designed for producers and mastering engineers who want all of their visual monitoring consolidated in one place rather than scattered across multiple third-party plugins.
The metering module is included free with the basic T-RackS CS installation in a limited form, and the full version is available as a paid module or as part of T-RackS 6 bundles.
For anyone already using T-RackS for mastering, the metering suite integrates naturally into that workflow and can be launched as a floating window on a secondary monitor so you can keep an eye on levels while working in the main processing chain.
- Loudness and Dynamics
The LUFS meter supports integrated, momentary, and short-term loudness readings that comply with major broadcast and streaming delivery standards. Preset configurations for platforms like Apple Music and various broadcast specifications let you confirm your output meets requirements without manually looking up target values.
The peak meter provides sample-accurate true peak measurement with digital overs warnings, while the RMS and dynamic range meters show the crest factor of your signal so you can gauge how compressed or dynamic your mix is at a glance.
The VU and PPM meters offer classic needle-style visual ballistics that some engineers prefer for tracking average loudness and transient behavior in a more intuitive, less numerically precise way. The ability to switch the display between left/right and mid/side metering modes gives you a secondary perspective on how the mono and stereo content relate to each other in terms of overall energy distribution.
- Spectrum and Phase
The real-time spectrum analyzer displays peak, RMS, and averaging modes simultaneously or individually, and the spectrogram provides a time-based frequency view that builds a color-coded history of your signal’s spectral content.
The frequency analyzer includes an optimal zone indication that highlights the expected loudness and RMS range based on genre and style selections, giving you a visual target to aim for during mixing and mastering.
Phase and stereo correlation are handled by a goniometer-style display that visualizes the stereo field as a rotating pattern, alongside a simpler correlation meter that indicates whether your signal is leaning toward mono, stereo, or out-of-phase territory. The mid/side meter provides additional information about the balance between center-panned and wide-panned content.
The metering suite runs as AU, VST, VST3, and AAX on macOS and Windows, and can also operate within the T-RackS standalone mastering application.
Hello, I’m Viliam, I started this audio plugin focused blog to keep you updated on the latest trends, news and everything plugin related. I’ll put the most emphasis on the topics covering best VST, AU and AAX plugins. If you find some great plugin suggestions for us to include on our site, feel free to let me know, so I can take a look!